Math in the Schoolyard

by Char Bezanson and Judy Killion
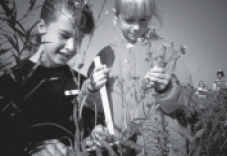
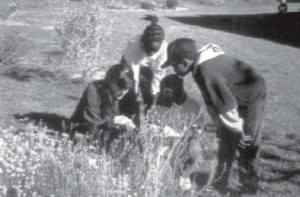
A schoolyard is a convenient setting for many math activities and is especially suited to concept application and problem-solving. Number sense, patterns and relationships, measurement, estimation, geometry, statistics and probability — mathematics is, at its root, a way of describing the world and its patterns. A nature area and the objects and phenomena within it can be estimated, counted, and measured, and the data collected can then be charted, tabled, averaged, graphed, and manipulated in many ways. We might teach fractions or percentages using pizzas or dollars, but these concepts can be extended by having students come up with ways to estimate the fraction of the sky covered by clouds or determine the percentage of their schoolyard that consists of asphalt or of lawn.
One of the best things about using the schoolyard for teaching is that it provides a direct connection to “the real world.” And the real world isn’t neatly divided into subject areas. Any activity done in a natural setting provides an opportunity for students and teachers to “double-dip,” meeting learning objectives in more than one area. A first-grade activity that involves measuring, counting, or sorting leaves may have as its primary objective the development of number sense and other math skills, but it also provides opportunities to observe texture, color, insect interactions, and the unity and diversity of life. Fifth-graders looking for patterns in the angles formed by twigs are fulfilling a geometry objective while simultaneously gaining experience with plant structure that can be built on in a science lesson, or which might inspire a poem or a painting.
In middle and secondary grades, concrete applications of math concepts in a schoolyard setting are especially useful in developing skills in divergent thinking. Middle-schoolers can devise a variety of ways to estimate quantities such as the surface area of a pond, the height of a tree, or the mass of a tree trunk, and determine the “best” solution for the specific problem to be solved. (For example, which method would be best for calculating the biomass, firewood, or board-feet contained in a tree? Which would be most precise? Which would involve the simplest tools?) Applying math skills in these ways helps students develop confidence in their ability to solve problems in other contexts and to design their own scientific investigations. High school students can learn about statistical sampling by documenting the number of species along a transect or in a series of study plots, and thus understand how they might apply such mathematical tools to learning about ecosystem diversity or other related topics.
Standards documents, state and provincial curriculum frameworks, textbooks, and other curriculum materials often include lessons and illustrations drawn from the real world. Many of these can be adapted to the schoolyard. Since no two schoolyards are the same, this adaptation does require forethought and creativity on the part of teachers. But the increase in student interest, motivation, and learning easily makes this investment of time worthwhile. Some starters are presented here, but once you begin using your outdoor classroom for math you’re sure to come up with many more ideas.
Primary Grade Activities
Patterns
Have students sort a collection of items (leaves, shells, rocks), using their own criteria (color, shape, size), and have other students try to “guess the rule.” Have children look for patterns in the schoolyard: the way leaves position themselves on stems, the number and arrangement of petals on the flower, the way the plants are planted in the garden areas, the way the fence is made.
Number sense
Count and graph plants or animals in the schoolyard. For example, on the first visit to a spring bulb garden students may count five purple crocuses and ten yellow ones. They then use squares of colored paper to make a histogram, one square per flower. As flowers come into bloom, the graph grows. While in the schoolyard, watch for the teachable moment. Example: There are birds on the fence, on the telephone lines, on the lawn. Count them, and then watch for one of them to fly away or another to arrive. Have students make a math sentence that tells what happened (7 sparrows – 2 sparrows = 5 sparrows) and illustrate the story problem on their clipboards.
Geometry
Go on a shape hunt to locate geometric shapes in the playground, gardens, and walkways. Give students a tally sheet with the shapes they are to look for and have them tally each time they find that shape. Extension: Have students draw the shapes and graph how many of each shape they found.
Measurement
Have students look for things to measure in the schoolyard, using both standard units and non-standard units. How many hand-widths wide is the path? How many steps? How would you measure an ant? What do you do when the plant is higher than the ruler? Practice using measuring tools: measure rainfall using rain gauges, temperature using thermometers, distance using tape measures, rulers, or string.
Graphing
Measure, count, and graph things that change over time such as temperatures, rainfall, the height of plants, the number of flowers in bloom, the length of shadows
Intermediate and Middle School Activities
Collecting and describing data
After listing some characteristics of their schoolyard, have students choose a subject on which to collect and graph data, such as heights, numbers, or circumferences of trees; lengths of stems between leaves; number of anthills per square meter. Collect and graph weather data over time. Create graphs to show how the temperature and rainfall in your area compare with those in another area of the country or world, using the Internet or the newspaper for reference.

Any activity done in a
natural setting provides
an opportunity for
studentsandteachersto
“double-dip,” meeting
learning objectives in
more than one area.
Number operations
Have students observe the outdoor classroom and record activities taking place in the form of word problems and mathematical sentences. Challenge them to find as many addition, subtraction, multiplication, and division stories as they can. Create a Playground Math Book with illustrations of these story problems and the math sentences that go with them. For example: The entire fourth grade is out playing softball. If there are two fourth-grade classes of 27 students each, and three softball fields, how many students are on each softball team if the students are evenly distributed in the fields?
Geometry
Have students use measured lengths of rope to create various geometric shapes and then calculate their perimeter and area. Find ways to estimate the area of irregular shapes. Identify and measure geometric shapes on the playground such as gardens and walkways, calculate their areas, and come up with related questions: How much fencing would be needed to fence a certain area of the playground? There are 450 students in our school. If they were all on the playground at one time how much space would each child have if we divided the area equally?
Measurement and estimation
Have a contest in which students measure and record everything they can find that is measurable within an allotted period of time. If they find something they think cannot be measured, such as a tall tree, have them make a note of it so the class can brainstorm whether it is indeed something that cannot be measured. If it cannot be measured precisely, can it be estimated? What strategies could be used?
Prairies Have a Lot of Gall
ROUND GALLS THAT MAKEA PLANT LOOKAS IF IT HAS SWALLOWED A ping-pong ball are common on the stems of Canada goldenrod (Solidago canadensis). The gall is a growth formed by the plant in response to the larva of the goldenrod gall fly, Eurosta solidaginis. In summer, the female fly lays an egg in the unfolded leaves of the plant’s topmost bud. After hatching, the larva tunnels into the growing tip and causes the plant to grow a ball-like deformation, forming a protective home for the hungry, growing larva. If it is lucky, the larva spends the entire winter in this chamber, emerging from the gall in early spring. Often, however, galls are pecked open in winter by chickadees or other hungry birds.
Sampling Activity: Since galls are large, obvious, and stationary, they are easy to observe and count, allowing students to practice sampling techniques while learning about plant-insect interactions. In the following activity, students count goldenrod galls in a small area in order to estimate the number of galls in a large area. If Canada goldenrod is not plentiful in your area, a local botanist or entomologist should be able to suggest an alternative (thousands of insects induce galls on a wide range of host plants).
1. Identify and examine goldenrod plants with ball galls. Cut one open to demonstrate the presence of the insect larva.
2. Measure the study area by using a tape or by pacing it off. Estimate the total area, mapping it if desired.
3. Choose several sample plots to count. For example, if your site has an area of 800 square meters, and you have 10 pairs of students, you could have each pair count the goldenrod galls in a plot measuring four square meters. Have students consider: What are some different ways to distribute the sample squares across the site? Which might be best, and why? (For example, you might try to avoid bias by choosing sample squares randomly, or in some regular pattern across the site.)
4. Assign a pair of students to each plot. When they have tallied their results, have each pair use only their own data to predict the number of galls on the whole site. Now, using data from all of the plots, determine the average number of galls per four-square-meter sample and estimate the number on the site. Is this number the same as the prediction? Which estimate do you think is more accurate? Extension: Students can count the number of goldenrod stems and the number of galls to determine the average number of galls per plant. Could this number be less than one? Both the number of goldenrod stems and the number and percentage of galls can be monitored from year to year in an area. — Char Bezanson
Char Bezanson is an ecologist and Regional Educator for the School Nature Area Project and teaches in the Education Department at St. Olaf College in Northfield, Minnesota.
Judy Killion teaches fifth grade math and science at Christie Elementary in Plano, Texas.
From Greening School Grounds
Leave a Reply
You must be logged in to post a comment.


I truly appreciate your work, Great post.