Feeling the Heat

Originally appears in the Winter 2016 issue
There are now more than 300 cities in the world with more than one million inhabitants[1]. Many of the materials used to construct those cities do not reflect heat well, and thus increased urbanization has led to a world-wide phenomenon now known as the urban heat island[2]. Those materials absorb heat radiation and release it slowly back into the atmosphere[3]. As a result, urban communities can be as much as 20 degrees Fahrenheit (11 degrees Celsius) warmer than the surrounding rural communities[4]. This human-created temperature difference results in “islands” of heat surrounded by areas of undisturbed cooler temperatures.
It wasn’t until I started incorporating lessons on urban ecology that I actually began to notice the types and amount of concrete, pavers, and asphalt that were used in the construction of our school campus, and how biodiversity had been stifled by this process. It was time for me to challenge my students to examine the hard surfaces on our campus. Their observations and questions would become the foundation of our study of the effects of urbanization, both on the natural environment and on human health and well-being. From these observations I have created a series of mapping activities that engage middle school students to explore the issues associated with the heat island effect. I share them with you here in hopes that you can use them with your own classes.
Studying the effects of man-made materials on the natural environment encourages students to examine their local surroundings and collect authentic data. At the present time, many ecology units focus on undisturbed ecosystems. Incorporating urban ecology lessons into these traditional units gets science students outside, in direct contact with their everyday surroundings. When students study our campus’ limited vegetation, they begin to appreciate these natural elements and how they are able to endure the increased heat caused by urbanization.
With access to technology such as Google Maps and Google Earth, students can engage in meaningful mapping activities that act as a bridge to what professionals now use to solve real-world issues. Educating students on the use of Global Positioning Systems (GPS) and Geographic Information Systems (GIS) can enhance a student’s understanding of current technology, its application in analyzing present conditions on Earth, and planning for the future. With these technologies, students will have no shortage of information and have the potential to become active participants engaged in authentic science, as opposed to memorizing a set of ready-made facts. As educators it is important to show the relevance of these tools and how they can impact one’s view of their surroundings. Allowing students to use their school campus to combine a number of different types of data from a series of maps can enrich their understanding of the increased heat and loss of biodiversity caused by the urban heat island effect. Additionally, this allows students to suggest changes that could mitigate the negative effects of human impact in the community and can be the key to fostering civic responsibility for their surroundings. The following lessons can be used with middle school students to create a GIS model of interactive maps in order to analyze the patterns and relationships of different elements on their campus.
Lesson 1: Identifying the Man-Made Elements on the School Campus
Description: This activity allows students to collect data on the man-made elements in their school courtyard and record the location and amount of these materials on an outlined map created using Google Earth.
Materials: clipboards, paper to outline map, table to record the types of materials, camera, colored pencils
Procedure: Begin with a class discussion about GPS technology and how it is used. Many students already know that this technology pinpoints the location and provides directions to a particular address. But they are unaware that the application of GPS data provides them with a tool to solve real world problems. There are websites, like the one listed in the resources section below, that will provide the basic facts, diagrams, and often a video to help with this portion of the lesson. Describe how GPS works and mention some of its applications. Divide the students into groups and have them use Google Earth to locate the school campus and print the image they find. The students can use the printout to trace an outline of the aerial view of their campus. Once it has been established that the students have an understanding of GPS, introduce GIS technology. GIS will demonstrate to the students that multiple layers of maps containing specific information can be combined into one all-encompassing map. This presentation can highlight that gathering multiple forms of data can help build a working model of the different elements on their school campus.
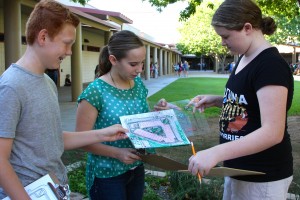
The students can now take their template of the school campus outside to identify and record the amount and types of man-made elements they observe by drawing them on the outlined map. Working in collaborative groups, the students decide how to show these elements on their map. These elements can then be color-coded and a legend can be created to further identify these found materials. The students can also use the camera to take photos of these elements to attach near the legend. As a group, the students will have gathered data of these man-made elements by creating a map, table of identified man-made elements, and photos of these materials.
An extension to this portion of the mapping project would be to introduce the different forms of heat transfer and relate that information to the identified man-made materials. Allowing the students to use infrared thermometers to collect temperature data to determine the warmest and coolest areas on their school campus will further support their growing awareness of which elements tend to add heat to the environment.
Lesson 2: Identifying the Plants on the School Campus
Description: This activity allows the students to collect data on the amount and types of plants on their school campus to create a second map.
Materials: Clipboards, first map of man-made elements, map outline on a transparency, table to record the types of plants, camera, colored overhead markers
Procedure: The students are out on the school grounds again but are now concentrating their observations strictly on the amount and types of plants. The same outline used to create the map of man-made elements will be printed on transparency paper and placed over the first map. The students can now draw the placement of each type of plant and simulate the series of maps used with GIS technology. Allowing the students to focus on just one element at a time can give them a greater awareness and appreciation for these separate elements on their campus. As in the first lesson, the students will also create a legend and set of photos for the different types of plants.
An extension to this portion of the mapping project would be to discuss the combined effects of evaporation from the soil and transpiration from the plants in order to show the effects of evapotranspiration on the surrounding temperatures.
Lesson 3: Mitigating Strategies to Reduce the Amount of Heat
Description: The students will analyze the two maps they created showing the ratio of man-made elements to plant life on their campus and work collaboratively to create a final map depicting their solutions to reduce the ambient temperature.
Materials: Clipboards, first two maps, map outline on transparency, table to record the additions to the map, colored overhead markers
Procedure: Now that the students have two distinct maps to assist them in understanding the separate elements that make up their school campus they can combine these maps. Combining them together will give greater insight into how they can mitigate any negative effects on the environment and plan for the future. The students will analyze their first two maps to determine what possible solutions could reduce the ambient temperatures on their school campus. The students can research different species of native plants that would have the optimal effect in reducing the temperatures and potentially have the additional benefit of increasing the biodiversity of their school campus. Any other strategies can be drawn on this final map. The students should still have the opportunity to go outside and discuss these mitigating strategies. By having the students use another transparency outline they can easily see the additional effects as a separate entity to be added to their school campus. It also allows them to easily change their model since this final map is a separate unit.
An extension to this final lesson would be to explain the cause and effects of the urban heat island effect that is taking place in urban communities. Many man-made materials, such as concrete, tend to absorb the radiated heat during the day, and radiate this heat back in to the atmosphere at night allowing for higher air temperatures. The most common mitigating strategy to reduce these higher temperatures is the addition of vegetation for shade and to add moisture back into the air through the process of evapotranspiration. The students can combine their maps to determine the most effective locations on their campus to help reduce the temperature. Understanding this phenomenon as the population continues to increase will help your students learn the importance of building models of their communities in order to encourage the planning process and build healthier urban landscapes.
Extension: Environmental Stewardship
One of the most impactful activities to follow these lessons would be to have the students choose one of their mitigating strategies and implement it on the school grounds. It is one thing to take them through the process of mapping but the final step should be a lesson in taking action. Even a small student-led change each year can create a large impact over time.
Understanding the balance between the natural and man-made elements within your community can give students a deeper understanding of what it takes to create a healthier urban environment. With the expansion of urban areas, the opportunity for people to experience nature is dwindling[5]. As educators we need to create more opportunities for students to experience the outdoors, collect authentic data, and understand current forms of technology used by scientists in the field to understand our ever-changing world. Teaching students what can be accomplished with the information they receive can help to guide them to make responsible conservation based decisions in the future.
Susan Ferguson teaches 7th grade science at Highland Junior High in Mesa, Arizona.
Resources:
- Official U.S. Government information about the Global Positioning System (GPS) and related topics. (2013). Retrieved from http://www.gps.gov/students/
- How does GPS work? Physics.org. Retrieved from http://www.physics.org/article-questions.asp?id=55
- National Geographic. GIS (geographic information system). Retrieved from http://education.nationalgeographic.com/encyclopedia/geographic-information-system-gis/
- Teach Engineering. (2015). What is GIS? Retrieved from https://www.teachengineering.org/view_lesson.php?url=collection/uoh_/lessons/uoh_dig_mapping_less1/uoh_dig_mapping_less1.xml
- National Geographic. Urban heat island. Retrieved from http://education.nationalgeographic.com/encyclopedia/urban-heat-island/
- EPA. (2015). Heat Island Effect. Retrieved from http://www.epa.gov/hiri/index.htm
Notes
[1] Barnett, M., Vaughn, E., & Cotter, L. (2011). Urban environmental education: Leveraging technology and ecology to engage in studying the environment. International Research in Geographical and Environmental Education, 20(3), 199-214.
[2] Chow, W., Brennan, D., Brazel, A. (2012). Urban heat island research in Phoenix, Arizona. American Meteorlogical Society, 4, 517-530.
[3] Harlan, S., Boudreau, D. (2012). Human Nature. Chain Reaction/Arizona State University, 7(1), 4-5.
[4] Zrioka, P. (2012). Paving the way to a cooler future. Chain Reaction/Arizona State University, 7(1), 6-7.
[5] Miller, J. (2005). Biodiversity conservation and the extinction of experience. Trends in Ecology & Evolution, 20(8), 430-434.
Leave a Reply
You must be logged in to post a comment.


