Stories in the Data

Originally appears in the Fall 2015 issue
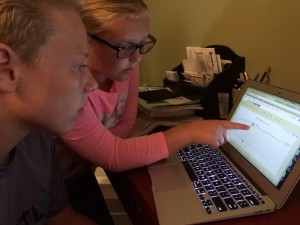
“The data’s wrong!” Matteo exclaimed. After being careful to plot the increasing amount of sunlight observed locally as we moved toward spring, the students were confronted with an anomaly in the data: An unknown location was reporting declining amounts of sunlight each day. As his teacher, Bob Coulter hesitated to provide answers when the kids could easily figure it out for themselves with a little detective work. So, he asked Matteo to double-check his work, and sure enough — the data showed less time between sunrise and sunset. In fact, the location Matteo was reacting to wasn’t the only one with this pattern. At the time, we were working with the Mystery Class project sponsored by Journey North . Participating classrooms receive clues each week (such as the local sunrise and sunset times) for a set of ten mystery locations, with a goal of discerning where each city is. With some encouragement to be patient and see what the next round of data brought, Matteo and the other students deferred their skepticism. In the coming weeks, intrigued by the data, they came to understand the different seasonal patterns experienced in the northern and southern hemispheres.
This is just one example of how data can inform students about the wonderful world we live in. Describing and tracking changes in the non-living (or abiotic) world is an important part of coming to understand the environment, locally and at a distance. In this article, we’d like to share three strategies to make this data accessible and meaningful to students at different ages throughout elementary and middle school.
This content is restricted to subscribers only.
If you are not yet a subscriber, please consider taking out a subscription here.
If you are an existing subscriber, kindly log in or contact us at info@greenteacher.com for more information.


